SURGE TESTS ON WINDINGS
This kind of test was first introduced in the USA in the ’50s as a production test; it was then introduced in Europe by RISATTI in 1958. The test with high voltage pulses (SURGE TEST) is the most severe, rapid and secure test for the detection of defects on any sort of electric winding, defects that are already present when the test is performed, or quiescent defects that will cause anomalies to the object in the future.
Defects on the insulation of a conductor (cuts, superficial breakages, cracking) do not initially create any problems, but after a limited period, thermic cycles, mechanical and electromagnetic stress, can create short-circuits with consequent burning of the winding.
The operating principle used is the following: a high voltage generator charges a capacitor where the energy is stored.
The capacitor is then discharged on the windings under test, at line frequency (50 times per second) using an SCR system. This causes severe stress to the winding, because the supplied high voltage steep edge creates conditions similar to those present and in the insulation between the turns, when electric machines are in their normal operating environments, with transient phenomenon due to atmospheric discharges, manoeuvres pulses, noises generated by particular machines (e.g. welders).
The resonance between the inductance of the winding under test, and the capacity mounted on the instrument, causes a damping of the oscillation on the discharged voltage.
The frequency of this oscillation is due to the inductance L of the winding under test (number of turns, type and quality of the iron, windings position, type of connection between the various coils), whilst the damping is due to the quality factor Q (absence of short circuits, leakages towards earth, etc.).
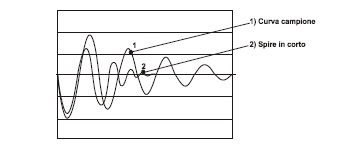
Comparing this curve with a sample one or with a curve stored in the memory, it is possible to detect differences due to all defects, even with reduced entity, such as short circuits between turns or between rods, wrong connections, different number of turns, damaged insulations, etc.
This is in order to point out the most useful and convenient information in the use of the system, taking into consideration our experience and our constant collaboration with the most known and competent industries, where serious laboratory tests have been carried out.
A – PULSE GENERATION
One of the main quality features of our machines is the generation system of high voltage impulse that, applied to the windings, causes the severity of the test.
Among all the possible systems, the most important and safe is the capacitor discharge system.
This system joins a long-term security and reliability with circuit simplicity, which means reliability compared to other systems.
The elements that determine the characteristics of the impulse generator are the following:
- the voltage rising speed
- the pulse energy
- the frequency of repetition of the pulses
The voltage rising speed is mainly caused by the kind of component used to close the circuit on the winding under test.
The schematic diagram is the following:
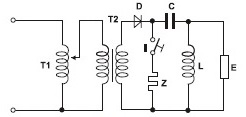
T1 = Voltage regulator
T2 = Transformer (voltage increase) system
D = Rectifier diode (1 semi-wave) diodes
C = Discharge capacitor electromechanical switch
Z = Protection impedance
I = Electronic switch. It consists in a system composed of SCR and fast diodes that simulate an electromechanical switch
L = Winding under test
E = Circuit for the detection and exam of the characteristic curve
Use T1 to set the voltage desired. This voltage value is a peak value, whilst values like the AC dielectric strength are true values.
The diode D charges the capacitor C when the switch I is open. In the next semi-period the diode D is not active, the switch I is closed and C is discharged on L.
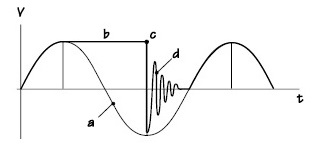
a = Voltage on the high voltage secondary winding of the transformer
b = Curve in bold: capacitor charge curve
c = Point where the electronic switch is closed
d = Discharge damping wave
The most significant part is that marked with – d -, which is the result of our test. Now, the voltage oscillation on the winding under test will be taken into consideration, when the switch I is closed.
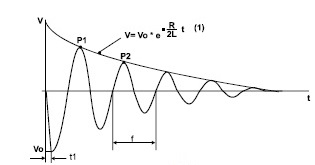
V = Oscillation damping curve due to the losses (Q factor)
Vo = Applied voltage
t1 = Voltage rising time (closing time of the electronic switch)
f= Resonance frequency of the oscillating circuit (the inductance L value in Henry is obtained)
P1-P2 = Peak values
It can be noticed that the oscillation frequency is caused by the resonance created by the internal discharge capacitor value, and the inductance of the winding under test, with the following relation:
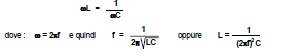
This is the theoretical side. Other factors that intervene to make each single winding curve individual are:
- the parasitic capacity between the turns and towards ground
- the serial protection inductor Z, positioned inside the instrument, that limits to specified values the peak current when a short circuit is detected on the windings under test. In this way, the electronic switch is not destroyed
- the leakage inductance
- the quality and the quantity of the iron core
- the ohmic resistance of the winding
All of the above features make each single winding individual, with a specific curve. This explains why, two identical windings built with different machines or using different supports for the coils, have different curves, sometime with considerable differences.
The damping of the oscillation V, is caused by R (ohmic resistance of the winding) and by L (inductance) as expressed by the formula relevant to the voltage variations during time.
Even in this case, there are other factors that modify the value, especially when are present insulation losses between the turns of the winding under test (complete or partial short circuit) or in case of leakages towards ground.
When one or more turns are short-circuited is like having a transformer with the secondary winding in short circuit: the inductance of the primary winding is drastically reduced and an anomalous energy consumption is present. It has to be taken into consideration the fact that, when number of turns in a winding is doubled, the inductance increases four times.
In our case the energy to be considered is that present in the capacitor (gained during the charge phase), and a faster oscillation damping will be observed.
It has also to be noticed that t1, voltage rising time, is a really important value; in fact as it was already explained in point A, the shorter it is more severe the test is.
In our instruments this time is comprised between 0,2 and 0,4 msec sec (CEI EN 60034-15).
For the explanation of Q and L values refer to point D.
B – PULSE ENERGY
The second point to be considered for the quality of the test is the impulse energy.
The impulse energy during a SURGE test is mainly given by the energy stored by the capacitor C, which is applied to the winding under test during the discharge phase.
The energy stored in the capacitor and applied during the discharge to the winding is:
W = ½ C V2
W=energy in Joule C =capacity value in Farad V =test voltage
The standard version of our machines, with a 0,05 µF capacitor and 5.000V maximum voltage, can supply a pulse with the following energy
W = 0,625 J
The energy value must be optimised in order to obtain an eventual discharge between the critical points in a winding, but at the same time, it must not be too high to avoid useless or even dangerous burnings.
Furthermore, because the value of the capacitor and the inductance of the winding form an oscillating circuit, when low values of inductance are present, the capacitance value must be reduced in the same way to obtain an oscillation that can be read on the monitor.
It must also be underlined the fact that there is a substantial difference between our test system and the test systems belonging to our competitors.
On our system, the electronic switch is a device that provides a complete short-circuit; this allows the capacitor C and the inductor L to be always connected. The resulting damped oscillation has constant frequency, giving a better use of the energy and a consequent higher severity in the test.
In other words, the Risatti bipolar switch permits to the load to start resonating with the discharge capacitor. This generates a stimulus on the winding under test in both directions. The voltage is applied with positive and negative values during each oscillation.
In some competitor systems, the switch .I. is single-directional (for cost reasons), therefore the energy stored by the capacitor is discharged on the inductor. Using a single-directional switch the inductor cannot be closed on the capacitor, therefore the winding starts resonating only within its natural frequency (parasitic capacities) causing in this way a dissipation of the energy of the impulse applied.
This can be noted on the waveform relative to the damped oscillation, which is derived: the frequency is lower in the first period but it is much higher in the end part (with consequent lower amplitude voltage). This is caused by the lower parasitic capacities when compared to the discharge capacities.
This method, using the same voltage level, is less severe than the method used by our systems because to obtain a better test it is necessary to supply a much higher initial energy. This energy in case of discharge will cause an extended damage (burn) in the critical point.
It must also be pointed out the importance of the impulses repetition speed in a determined time (minute). This speed must be adequate to simulate a life test capable to point out all the possible weak points in a winding.
C – TEST VOLTAGE
Several regulations (in particular those regarding windings in large electrical machines) give suggestions for the choice of the value for test voltage parameter (IEC 34-15, IEEE 522, etc.). To choose this value it is used the same principle used with the Dielectric Strength test. The only difference consists in the fact that the value is a peak value. The following formula is used:
Vp = (2 V + 1000) x K
where:
Vp = test voltage
V = operating voltage of the winding under test
K = Constant value variable between 1,2 and 1,6 chosen by the user
This value is conditioned by the fact that the pulse voltage is a peak voltage (1,41 of the RMS value). The range allowed takes into care the characteristics of the winding under test and required quality to be reached.
It is very important to point out that there can be big differences between the set test voltage and the one actually present on the winding under test.
Taking into consideration the picture, it can be noticed that impedance Z is positioned to protect the electronic switch in case of a short-circuit. This impedance, added to the impedance of the connecting cables and the impedance of the switching circuits, causes a voltage drop that is proportional to the impedance value of the load (limit case: load in short-circuit, voltage = 0).
Therefore, especially when very low inductance values are present (windings with limited number of turns and small quantity of iron) the voltage drop can be extremely important to influence the severity of the test.
It is always important to verify the correct voltage value applied to the winding, especially when low impedances are present.
This is obtained by counting the amplitude in centimetres (squares per division) of the first peak of measured curve. This value, shown on the left of the display, must be multiplied by the value of the voltage divisor (V/cm.), which is shown on the left bottom part of the display (i.e.: 4 squares – 200 V/cm = 800 V pulse voltage which is applied to the ends of the winding under test).
D – EXAMINE OF THE CHARACTERISTIC CURVES
The result of the SURGE-TEST on the turns of a winding are valued considering 2 parameters: L and Q.
L = indicates the inductance value on the winding.
It is calculated using the resonance frequency (f) as seen in the pictures (and relevant explanation) that varies according to the number of turns, to the connections of the various windings between each other and to the iron core. When the measured value is different from the stored one, the reason can always be found in one of the reasons above.
Q =the value indicated is related to the oscillation damping time as seen in the picture (and relevant explanation), due to the losses in the existing insulation. The value is generated by the ratio of the peak values of the first oscillations.
The higher is the Q value, the lower is damping and so better is the quality of the device under test (absence of shorts between the turns, absence of shorts between the windings, leakages).
In the tests, when using a memorised sample curve, for a correct evaluation of the device under test, the following relations are used:
Qs = Sample quality factor Ls = Sample inductance
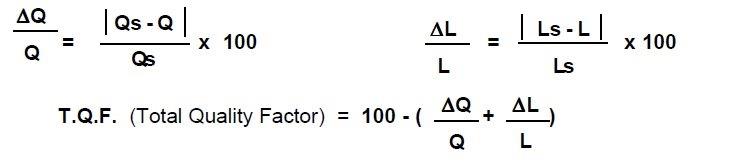
The quality of the device under test is better when the value is close to 100
All values are shown on the display; through the settable thresholds, you can have the automatic GO – NO GO test result, shown on the green and red LEDS.
All data can be printed (when the optional printer is available).
A third parameter must be considered for the evaluation of the quality in a winding: the presence of the “Corona effect”, also known as “partial discharges”.
This effect happens when in 2 points the winding insulation is not perfect; this generates a small quantity of electron loss. Due to the limited quantity, it is not possible to generate a real discharge.
The phenomenon, if seen in the dark, it seems like a light glowing around the cable (“crown effect.). The effect also generates an acoustic noise, a crackling noise which intensity is more or less strong according to the entity of the loss.
This effect, even if it is not extremely important, can cause in a short period of time a quicker deterioration of the insulators in that specific point, and later on, even the burning of the winding.
On the display of our machines, this phenomenon is displayed as an over-oscillation, with a frequency usually included between 2 to 4 and 10 MHz, present on the top part of the sinusoid, as shown below, that decreases in intensity with the reduction of the oscillation.
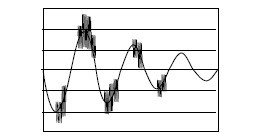
On the computerised instruments for production tests (H4/C – H5/C – H14/C), the phenomenon, can be visually displayed and can be automatically detected and quantified for a more complete analysis of the entire production.
It is necessary to make some important considerations.
The “Corona effect” is the indicator of a poor insulation; therefore, even if it is not a real anomaly, it probably means a shorter life for the winding under test.
In any case, to avoid excessive alarms, it is necessary to remember that the partial discharges happen in the air between two points, the room humidity and the temperature can significantly influence their entity.
This must be considered, especially on automatic detection systems.
It is in fact extremely difficult to define acceptance thresholds that can be considered valid for all environmental conditions, and that can remain constant in time.
It is usually better to increase the test voltage (little percentage point) in order to reach the discharge and ignore this factor.
In any case, SURGE TEST is normally performed on windings that are not yet impregnated (this because the situation is more critical and because it is easier to execute eventual repairs), therefore, in the points where small abrasions or holes in the enamel are present, when the impregnation varnish is given, the problem usually disappears.